Two days ago, the Congressional Budget Office released its latest long-run fiscal forecast. The report focuses – incorrectly – on the growth of red ink.
And most of the people who have written about the report also have focused – incorrectly – on the rising levels of debt.
That’s the bad news.
The good news is that the report also contains lots of data on the variables – the spending burden and the tax burden – that should command our attention.
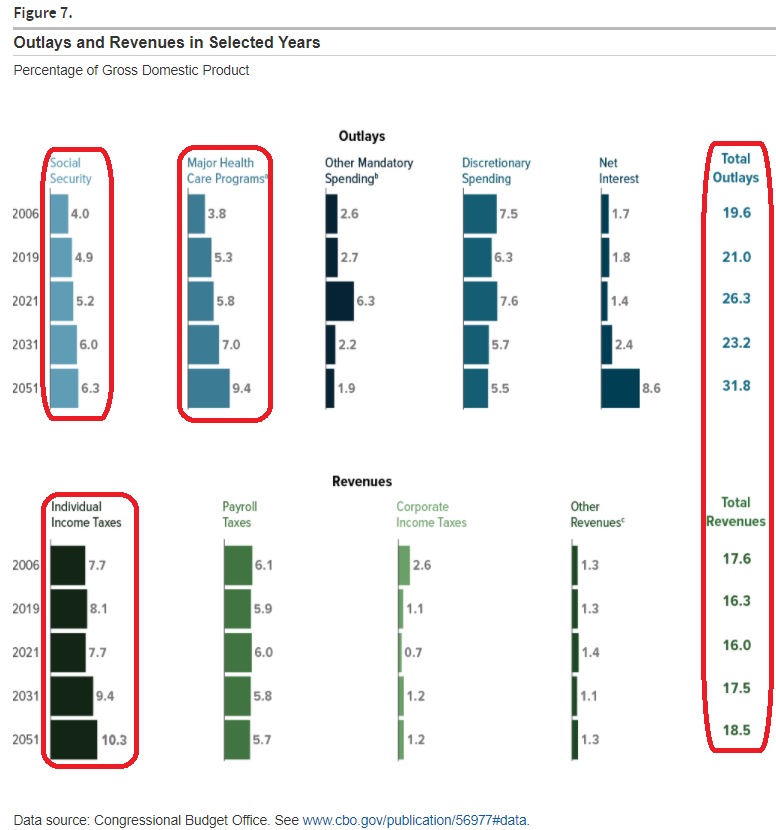
Here are four visuals from the report. We’ll start with Figure 7, which shows what will happen to spending and taxes over the next three decades. I’ve highlighted in red the most important numbers.
The right-most column gives you the big picture. The main takeaway (and it’s been this way for a while) is that more than 100 percent of America’s long-run fiscal problem is driven by the fact that government spending (“total outlays”) will consume a much greater share of our economic output.
The top-left of Figure 7 shows the growth of entitlement programs (which captures the fiscal problems of Social Security, Medicare, and Medicaid).
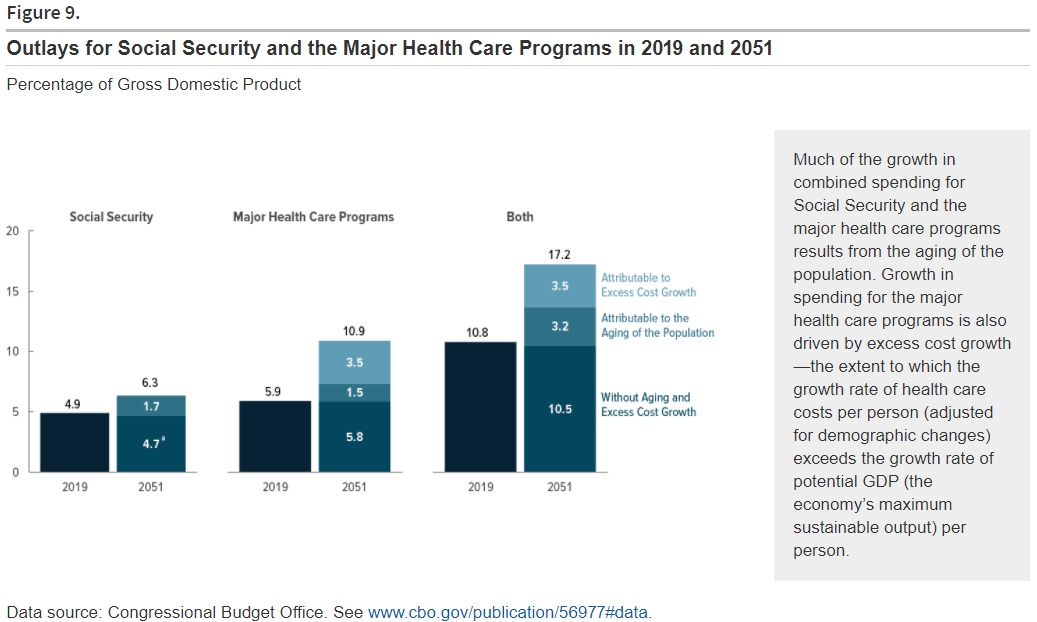
So lot’s look at Figure 9, which presents the same data in a different way.
The moral of the story is that America desperately needs genuine entitlement reform.
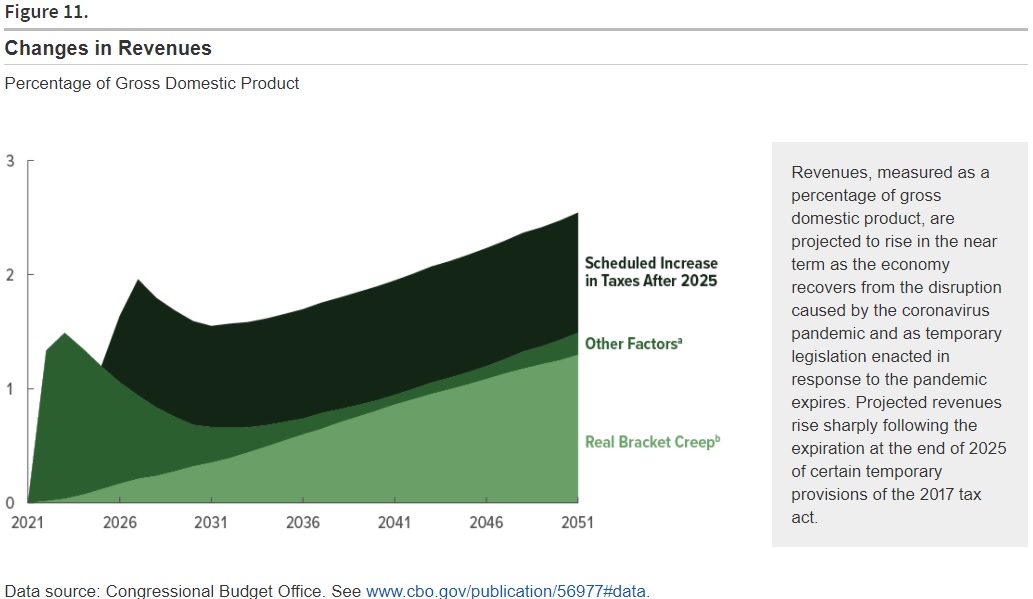
Why did I write above that government spending is responsible for “more than 100 percent of America’s long-run fiscal problem”?
Because, as depicted in Figure 11, there’s a built-in tax increase over the next three decades.
In other words, the fiscal mess in Washington is not the result of inadequate tax revenue.
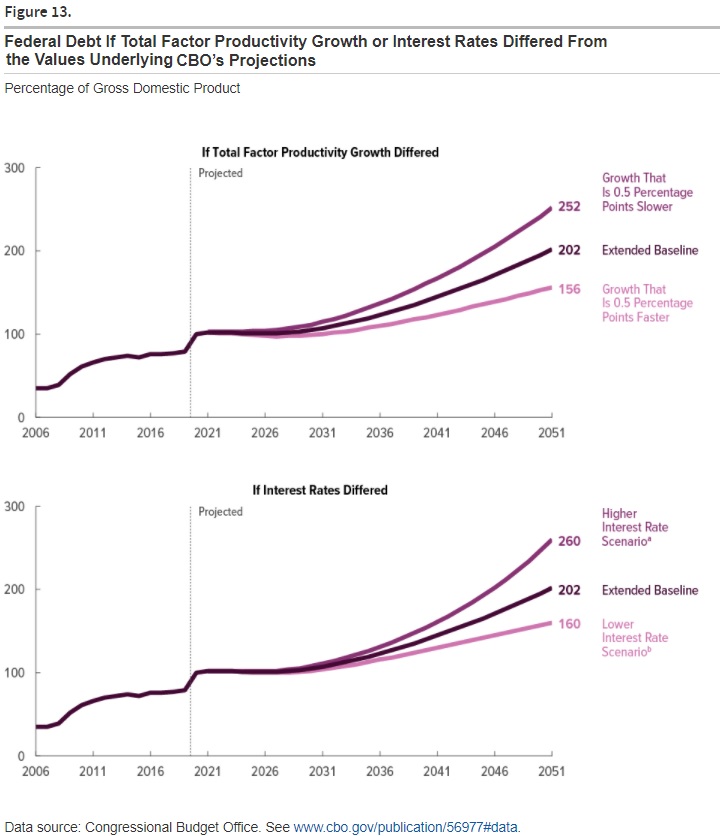
Last but not least, Figure 13 is worth sharing because it shows how small differences in some variables can make a big difference over time. I’m especially interested in the top chart, which shows how slight differences in productivity (which determines the all-important variable of per-capita growth) have a big impact on long-run debt.
It would be preferable, of course, if the CBO report showed how greater productivity impacts both revenue and spending. We would see that faster growth generates more tax revenue (without raising tax rates) and reduces spending (people with good jobs are less likely to be dependent on government redistribution programs).
P.S. Yes, government debt matters. It matters in the short run because it’s a measure of how much private saving is being diverted to finance government. And it matters in the long run because excessive red ink can trigger a fiscal crisis when investors decide that a government no longer can be trusted to pay back lenders (see Greece, for instance). But we should never forget that it is excessive spending that drives the debt. Cure the disease of excessive spending and it is all but certain that you eliminate the symptom of red ink.
P.P.S. For what it’s worth, the United States is not Greece. At least not yet.
P.P.P.S. But we will be if there’s not some long-run spending restraint (an approach that worked in the 1800s), which almost certainly would require a spending cap.
P.P.P.P.S. There is zero evidence that tax increases would be successful. Indeed, that approach would make matters worse if history is any guide.


No comments:
Post a Comment